雅思报告样例
✨ 这些是真实的高级版报告。
立即体验6.5/9.0
总分
B2
CEFR 等级
回答给出了清晰的总体趋势和部分关键对比,但包含不准确的细节以及缺乏依据的解读,例如对变化原因的推测。
报告总体上按逻辑顺序组织,但衔接有时显得生硬,部分句子削弱了对比的清晰度。
词汇足以描述趋势,但用词常常偏口语化或不够准确,并存在若干搭配错误。
写作混合使用了简单句和一些较复杂的结构,但动词、主谓一致及名词形式上的频繁语法错误降低了准确性。
详细反馈
Academic Task 1
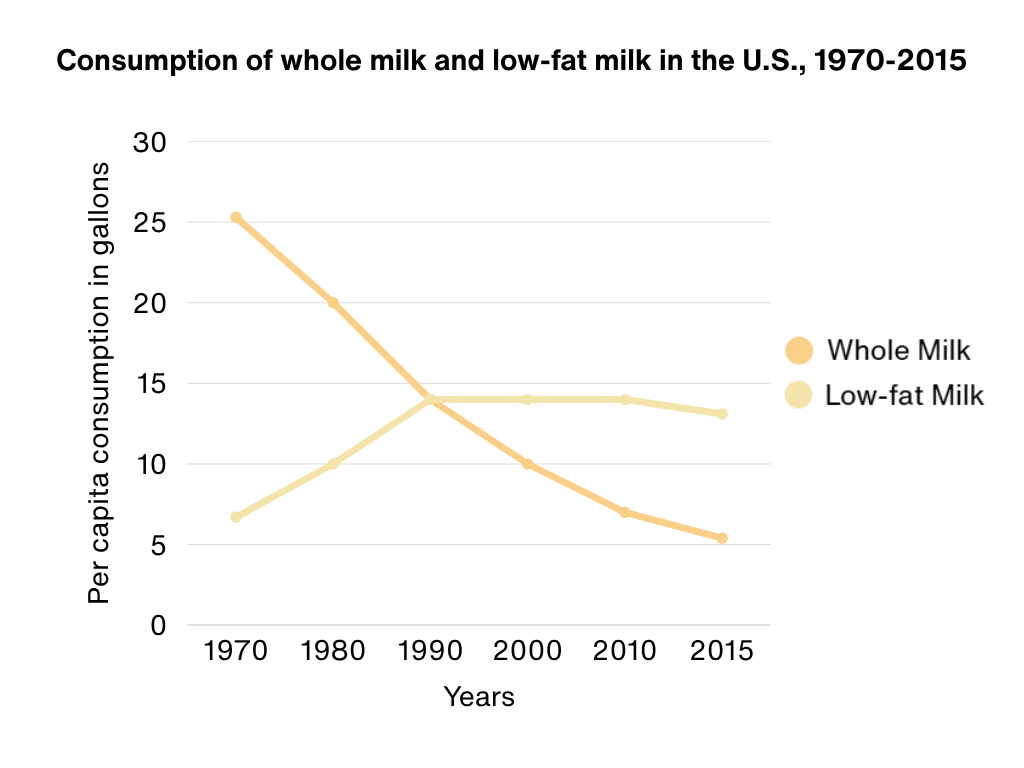
The graph below shows the per capita consumption of whole milk and low-fat milk in the United States between 1970 and 2015. Summarize the information by selecting and reporting the main features, and make comparisons where relevant.
226词
太棒了!你已达到 150 词的最低字数要求。
直接复制自写作题目的内容不计入字数。
你的答案
The line graph shows how much milk people in the US drink per person from 1970 to 2015, comparing whole milk and the low fat one. Overall it is clear that people prefer low fat milk more and more and whole milk go down a lot.1 I think the biggest change is people switch to healthy milk.1 In 1970 Americans drank about 25 gallons of whole milk but only around 6 of low fat. By 1980 the figure for whole milk drop to roughly 20 while low fat increased to about 10 liters.2 This is a very big increase, maybe fifty percent.3 In the 1990s they are almost the same, near 15 each, so the gap is closed.4 After that whole milk keeps decreasing to 10 in 2000 and about 6 in 2010, then close to 5 percent in 2015.5 On the other hand, low fat went up to around 14 and then it stayed almost stable for many years before a small fall at the end.6 To conclude, people changed their habit and moved from full fat to low fat because of health reasons and advertisements etc. The total amount of milk together looks about similar over time, but low fat already overtake the other one around 2000 which shows a strong preference of modern peoples. The chart is easy to understand so the trends are obvious.7
任务完成错误
Overall Overall, it is clear that people prefer low fat milk more and more and whole milk whole milk go down a lot. I think consumption fell steadily and sharply over the period, while low-fat biggest change is people switch to healthy milk. milk consumption rose until about 1990 and then stayed almost unchanged. Whole milk was much higher at the beginning, but low-fat milk became the more consumed type later.
总体概述应当报告图表所呈现的主要趋势,而非个人观点。"people switch to healthy milk"是一种图表未支持的解读。更好的概述应清楚指出全脂奶的急剧下降、低脂奶的上升及随后的稳定,以及哪种奶更受欢迎的转变。
By 1980 the figure for whole milk drop dropped to roughly 20, while low fat low-fat milk increased to about 10 liters. gallons.
图表两条曲线均使用加仑为单位,因此"10 liters"用错了单位。在 Task 1 中,数据和单位的准确性很重要。
This was a clear very big increase, increase maybe fifty percent. from about 6 gallons to around 10 gallons.
图表给出的是近似值,因此最好直接用数据描述变化,而不要添加如"maybe fifty percent"这样不确定的计算。这样能让报告更准确、依据更充分。
In 1990s they are almost the same, near 15 each, so the gap is closed. 1990, the two figures were equal at about 14 gallons.
图表显示的是 1990 年的一个数据点,而非对整个十年的笼统陈述。此外,两种奶的数值约为 14 加仑,而非 15。此修改使对比更精确、更准确。
After that whole milk keeps decreasing to about close to 5 percent in 2015. that, whole milk kept decreasing to about 7 gallons in 2000, and around 6 gallons in 2010, and close to 5 gallons in 2015.
这里存在两个任务完成度问题:2010 年的数值更接近 7 而非 6,且原文中的单位是百分比而非加仑。准确报告数据是必要的。
On the other hand, low fat went up to around about 14 gallons low-fat milk rose to about 14 gallons by 1990 and then stayed almost stable for many years remained at around this level in 2000 and 2010, before a small fall at the end. falling slightly to about 13 gallons in 2015.
这句话总体思路正确,但需要从图表中获得更具体的支撑。补充关键年份和数据可改善对该趋势的描述。
To conclude, people changed their habit and moved from full fat to low fat because of health reasons and advertisements etc. The total amount of milk together looks about similar over time, but low fat already overtake the other one around 2000 which shows a strong preference of modern peoples. The chart is easy to understand so the trends are obvious. [Removing this paragraph]
这段结论加入了图表未显示的原因和观点,例如"health reasons and advertisements"。Task 1 不要求结论,个人观点会降低分数。关于低脂奶超越全脂奶的关键对比本应在正文中作出。
[After 'On the other hand...' paragraph] Add: Low-fat milk overtook whole milk after 1990: low-fat was higher in 2000, 2010 and 2015.
图表的一个关键特征是哪种奶的消费量更高这一变化。你的报告提及了两种趋势,但没有清楚说明低脂奶在何时、以何种方式超越全脂奶。直接补充这一对比可提高任务完成度分数。